Cover Story

Inside The Colossal Empire Of Gautam Adani

Half a dozen new ventures from the Adani Group are ready to unlock value in the near future. This, on top of the already zooming market cap of the group’s listed enterprises, would be like icing on the cake for shareholders and investors

Read more

BT500 Report Card

BT500 Report Card

Top 10 Companies In 2022

Reliance Industries Ltd.
1

Reliance Industries Ltd.

Market Cap: Rs. 17.01 Lakh Cr

Tata Consultancy Services Ltd.
2

Tata Consultancy Services Ltd.

Market Cap: Rs. 12.81 Lakh Cr

HDFC Bank Ltd.
3

HDFC Bank Ltd.

Market Cap: Rs. 8.11 Lakh Cr

Infosys Ltd
4

Infosys Ltd.

Market Cap: Rs. 6.93 Lakh Cr

Hindustan Unilever Ltd.
5

Hindustan Unilever Ltd.

Market Cap: Rs. 5.54 Lakh Cr

ICICI Bank Ltd.
6

ICICI Bank Ltd.

Market Cap: Rs. 5.33 Lakh Cr

Housing Development Finance Corporation Ltd.
7

Housing Development Finance Corporation Ltd.

Market Cap: Rs. 4.46 Lakh Cr

State Bank Of India
8

State Bank Of India

Market Cap: Rs. 4.43 Lakh Cr

Life Insurance Corporation of India
9

Life Insurance Corporation of India

Market Cap: Rs. 4.43 Lakh Cr

Bharti Airtel Ltd.
10

Bharti Airtel Ltd.

Market Cap: Rs. 4.18 Lakh Cr

Reliance Industries Ltd.
1

Reliance Industries Ltd.

Total Income: Rs. 7.15 Lakh Cr

Indian Oil Corporation Ltd.
2

Indian Oil Corporation Ltd.

Total Income: Rs. 5.93 Lakh Cr

Oil & Natural Gas Corporation Ltd.
3

Oil & Natural Gas Corporation Ltd.

Total Income: Rs. 5.41 Lakh Cr

industan Petroleum
4

Hindustan Petroleum Corporation Ltd.

Total Income: Rs. 3.52 Lakh Cr

Bharat Petroleum Corporation Ltd.
5

Bharat Petroleum Corporation Ltd.

Total Income: Rs. 3.49 Lakh Cr

Tata Motors Ltd.
6

Tata Motors Ltd.

Total Income: Rs. 2.98 Lakh Cr

Tata Steel Ltd.
7

Tata Steel Ltd.

Total Income: Rs. 2.45 Lakh Cr

8

Rajesh Exports Ltd.

Total Income: Rs. 2.43 Lakh Cr

Hindalco
9

Hindalco Industries Ltd.

Total Income: Rs. 1.96 Lakh Cr

Tata Consultancy Services Ltd.
10

Tata Consultancy Services Ltd.

Total Income: Rs. 1.96 Lakh Cr

Reliance Industries Ltd.
1

Reliance Industries Ltd.

Total Assets: Rs. 14.99 Lakh Cr

Oil & Natural Gas Corporation Ltd.
2

Oil & Natural Gas Corporation Ltd.

Total Assets: Rs. 5.82 Lakh Cr

NTPC Ltd.
3

NTPC Ltd.

Total Assets: Rs. 4.24 Lakh Cr

Indian Oil Corporation Ltd
4

Indian Oil Corporation Ltd.

Total Assets: Rs. 4.22 Lakh Cr

Bharti Airtel Ltd.
5

Bharti Airtel Ltd.

Total Assets: Rs. 3.44 Lakh Cr

Tata Motors Ltd.
6

Tata Motors Ltd.

Total Assets: Rs. 3.27 Lakh Cr

Larsen & Toubro Ltd.
7

Larsen & Toubro Ltd.

Total Assets: Rs. 3.17 Lakh Cr

Grasim Industries Ltd
8

Grasim Industries Ltd.

Total Assets: Rs. 2.89 Lakh Cr

Tata Steel Ltd.
9

Tata Steel Ltd.

Total Assets: Rs. 2.82 Lakh Cr

10

Power Grid Corporation of India Ltd.

Total Assets: Rs. 2.63 Lakh Cr

Reliance Industries Ltd.
1

Reliance Industries Ltd.

Total PAT: Rs. 0.68 Lakh Cr

Oil & Natural Gas Corporation Ltd.
2

Oil & Natural Gas Corporation Ltd.

Total PAT: Rs. 0.48 Lakh Cr

Tata Steel Ltd.
3

Tata Steel Ltd.

Total PAT: Rs. 0.41 Lakh Cr

Tata Consultancy Services Ltd.
4

Tata Consultancy Services Ltd.

Total PAT: Rs. 0.38 Lakh Cr

5

Indian Oil Corporation Ltd.

Total PAT: Rs. 0.24 Lakh Cr

Vedanta Ltd.
6

Vedanta Ltd.

Total PAT: Rs. 0.24 Lakh Cr

Infosys Ltd.
7

Infosys Ltd.

Total PAT: Rs. 0.22 Lakh Cr

JSW Steel Ltd.
8

JSW Steel Ltd.

Total PAT: Rs. 0.2 Lakh Cr

Coal India
9

Coal India Ltd.

Total PAT: Rs. 0.17 Lakh Cr

Power Grid Corporation of India Ltd.
10

Power Grid Corporation of India Ltd.

Total PAT: Rs. 0.17 Lakh Cr

BT500 Rankings

Companies Comparison

Companies Comparison

The Rich List in 2022

*Figures calculated by multiplying the total number of shares held by promoters as of September 30, 2022 and market price on November 24, 2022

Methodology

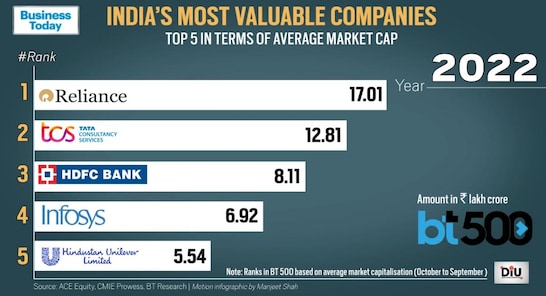
India's largest companies have been ranked based on market capitalisation by Business Today every year since 1992. This year's rankings are based on the average market capitalisation of the companies for the 12-month period from October 1, 2021 to September 30, 2022.

We began with a master sample of 4,271 listed and actively traded companies. We have used the BSE market capitalisation for all cases, except companies that are listed only on the NSE. Some 230 companies that were not traded on at least 20 per cent of the 249 total trading days in the October 2021-September 2022 period, were excluded from the list. Thereafter, we extracted the average (daily) market capitalisation of each company over the period under consideration and used it to rank the top 1,000 companies.

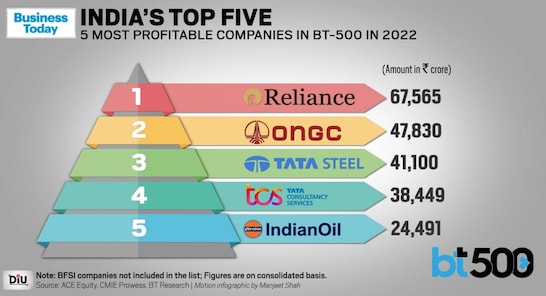
For a deeper perspective, we have also provided the average market capitalisation over the past two fiscals (FY22 and FY21), return on net worth (RONW) and return on capital employed (ROCE), in the tables. We have also ranked companies based on assets, profit after tax, total income and debt, and taken only consolidated numbers except in cases where companies don't report their consolidated results.

Data provider (ACE Equity) has not considered share of profit/loss of associates and joint ventures for calculating profit after tax wherever applicable.